
How to Analyze Watch Time by Region
Want to grow your YouTube channel? Start by analyzing your watch time by region. This data not only shows where your audience is but also helps you tailor content, optimize revenue, and improve engagement. Here's what you need to know:
- Why Watch Time Matters: YouTube prioritizes videos with higher watch time for recommendations. Mobile users drive ~70% of watch time, favoring shorter, fast-paced content.
- Regional Insights: Top regions can reveal revenue potential (e.g., U.S. viewers generate 3–5x higher CPM than Indian viewers). Adding subtitles for non-English markets can boost watch time by up to 40%.
- Using YouTube Analytics: Navigate to YouTube Studio > Analytics > Audience to find the "Top Geographies" report. Use filters and custom date ranges to identify trends and patterns.
- Optimizing Content: Create region-specific content, translate titles/descriptions, and schedule uploads based on when your audience is most active. High-CPM regions like the U.S. and UK offer better revenue opportunities.
- Advanced Tools: Platforms like Outlier provide deeper insights, suggesting high-demand topics and analyzing competitor performance.
Start small - adjust your upload schedule, add subtitles, or refine content for key regions - and track the results over time.
Accessing YouTube Analytics
You can find your watch time data in YouTube Studio. Knowing exactly where to look will save you time and help you focus on the most important insights.
Logging into YouTube Studio
Start by signing in to YouTube Studio and selecting Analytics from the left-hand menu. If you manage more than one channel, make sure you're logged into the correct account before diving into the data. This step is key to avoiding any confusion about performance metrics.
Once inside, click on Analytics, which will take you to the Overview tab. Here, watch time is prominently displayed as one of the main metrics. Fun fact: The YouTube Creators channel, dedicated to providing official analytics tips, has around 9.84 million subscribers. Even YouTube itself stresses the importance of understanding these numbers.
Once you've confirmed access, you can start exploring the detailed Analytics dashboard.
Finding the Analytics Tab
The Analytics dashboard is divided into several tabs: Overview, Content, Reach, Engagement, Audience, Revenue, and Trends. For analyzing regional watch time, you'll primarily focus on the Audience tab, where the "Top geographies" report reveals which areas contribute the most to your channel's watch time.
For deeper insights, click ADVANCED MODE or SEE MORE. These options allow you to filter data by geography or traffic sources, giving you a clearer picture of your channel's performance in specific regions. You can even save up to 50 custom reports for easy reference later. Keep in mind, however, that standard downloaded reports are capped at 500 rows of data, so plan your exports accordingly.
sbb-itb-08cadfc
Filtering Watch Time Data by Region
Understanding which countries contribute the most to your channel's performance can help you refine your content strategy. By filtering your Analytics, you can pinpoint the regions with the highest watch time and focus your efforts accordingly.
Using the Geography Report
Start by navigating to the Audience tab. Here, you’ll find the Top Geographies card, which highlights your leading regions at a glance. Keep in mind, though, that this card only shows the top results.
To dive deeper, click SEE MORE on the Top Geographies card. This opens the full Geography report in Advanced Mode, where you’ll get access to detailed metrics like watch time (in hours), views, and average view duration for each country. To rank regions based on engagement, sort the data by "Watch time (hours)." The report also includes visualization tools like line charts, bar charts, and an interactive map, where darker shades indicate higher viewership levels.
Important to note: Geographic data might not appear for real-time reports, private videos, or unlisted content. Additionally, regions with low traffic may have limited data available.
For deeper insights, adjust the date range to track performance changes over time.
Adjusting Date Ranges
Once you’ve accessed the detailed geography data, tweaking the time period can reveal trends and patterns. By default, YouTube shows data from the last 28 days, but you can modify this for a broader perspective.
Options include predefined periods like Last 7 days, Last 90 days, or Lifetime, or you can use the Custom option to set specific start and end dates. To compare trends, use the Add comparison feature, which allows side-by-side analysis of two periods - for example, this month versus last month. This is particularly useful for identifying whether a surge in watch time from a region is a one-time occurrence or part of a longer trend. You can also adjust the chart granularity to display data by day, week, or month, making it easier to spot sudden spikes or long-term shifts.
This level of analysis helps you better understand regional preferences, enabling you to tailor content that resonates with your audience.
Reading Regional Watch Time Data
Once you've accessed your geography report and set the appropriate date range, the next step is to make sense of the data and how it connects to your channel's growth and revenue. Here's how to identify your top regions and interpret key trends.
Finding Your Top Regions
Top regions are the countries contributing the most watch time to your channel. These are the audiences that already connect with your content, and they deserve your focus. To find them, sort your geography report by "Watch time (hours)" to see which countries are driving the majority of your engagement.
Don't overlook the revenue aspect. Viewers from high-CPM countries like the US, UK, or Canada can generate 3–5 times more revenue compared to those from regions like India or Pakistan.
"Geographic viewer mix affects your RPM dramatically - a channel with 80% US/UK/Canada viewers will have 2–3x higher RPM than a channel with 80% India/Pakistan viewers." - FluxNote
If high-CPM regions account for significant watch time, consider creating more content tailored to those audiences. On the other hand, if lower-CPM regions dominate your viewership, you may need to increase your content output to meet revenue goals. This kind of analysis helps you fine-tune your strategy, optimize earnings, and align with audience preferences.
Once you've identified your top regions, it's time to dig deeper into trends and changes.
Recognizing Patterns and Unusual Changes
After identifying your leading regions, watch for sudden spikes or drops in viewership. A sharp increase in watch time from a specific country might mean YouTube's algorithm is recommending your content to new audiences. Since watch time heavily influences recommendations, this could create a ripple effect if you act quickly.
Pay attention to unexpected audiences. A surge in viewership from non-English speaking regions might indicate a need for subtitles or translations, which could increase watch time by as much as 40%.
Also, keep an eye on gradual declines in key regions. This could point to changing viewer interests or increased competition. Use the comparison feature in your analytics to evaluate two periods side by side - like the last 90 days versus the previous 90 days - to figure out if the changes are temporary or part of a larger trend.
Finally, remember that most global watch time (about 70%) happens on mobile devices. Ensuring your content is mobile-friendly can make a big difference in retaining and growing your audience.
Using Regional Data to Improve Your Content
Best YouTube Upload Times by Region for Maximum Watch Time
Once you've analyzed your regional data, it's time to put those insights to work. By tuning your content to match the preferences of your audience in different regions, you can drive higher engagement and even boost your revenue. Here's how to make it happen.
Creating Content for Your Top Regions
To connect with your audience in specific regions, aim to make your videos more relatable without straying from your channel's core identity. Small tweaks can make a big difference.
Incorporate local landmarks and imagery in thumbnails. For example, using Tokyo Tower in thumbnails for Japanese viewers can increase click-through rates by 14%. If your audience is concentrated in the UK, include iconic British landmarks or references that resonate with viewers there.
Tailor topics to regional interests. Let’s say your analytics show a strong following in Germany, and you run a business-focused channel. You could create content featuring German companies or discuss European business practices. This approach makes your content feel more relevant, which can keep viewers watching longer.
Add subtitles for non-English speaking audiences. Non-English markets make up over 70% of YouTube users, and localized captions can improve completion rates by 31%. Opt for human-reviewed subtitles rather than relying solely on auto-generated ones, as automated captions can be less accurate - especially for accented English, where accuracy drops by 27%.
"Unexpected international audiences can reveal content localization opportunities." - Aditi, OutlierKit
Adjust your revenue strategy based on regional CPMs. For instance, if Norway or the US is a top region for your channel, focus on creating advertiser-friendly content to maximize AdSense revenue, as CPMs in these areas are significantly higher. However, if your audience is in regions like Vietnam ($0.82 CPM) or Nigeria ($0.31 CPM), explore alternative monetization methods like affiliate marketing or brand sponsorships.
Once your content is regionally optimized, fine-tuning your titles and metadata can help you reach even more viewers.
Improving Titles and Metadata for Regional Audiences
YouTube Studio offers a localization feature that allows you to set region-specific titles and descriptions without needing to re-upload your videos. This is a powerful tool to make your content more accessible and appealing.
Translate titles and descriptions into key languages. Translating your metadata into the primary languages of your top regions can increase watch time by 40%. Make sure to include important keywords within the first 60 characters of your translated titles for better visibility.
Research regional search habits. Search behaviors vary widely across regions. Some audiences lean toward "how-to" searches, while others focus on entertainment. Use YouTube's search suggestions in different languages to understand what your audience is actively looking for.
Adjust your tone for regional demographics. If your analytics show a younger audience in a specific region, use more casual language and include references that resonate with their interests. For older demographics, a professional tone might be more effective.
Finally, timing matters - publishing your videos at the right time can significantly improve your results.
Publishing at the Right Times for Different Regions
When you publish your videos can impact watch time by as much as 37%. Timing your uploads to align with your audience's habits is crucial.
Leverage YouTube Studio's "When your viewers are on YouTube" feature. Check the heatmap under Analytics > Audience to identify when your viewers are most active. Aim to upload your videos about 2 hours before peak activity to give YouTube's algorithm time to process and recommend your content.
A study of 17 engineering education channels in January 2026 showed that uploading at 2 a.m. UTC resulted in 22% higher 7-day retention compared to 2 p.m. UTC. This early slot captured both APAC morning viewers and European late-night viewers, while the afternoon slot only aligned with the creators' local time.
"Efficiency here means aligning with audience rhythm, not personal convenience." - Leo, Smart Home Systems Engineer
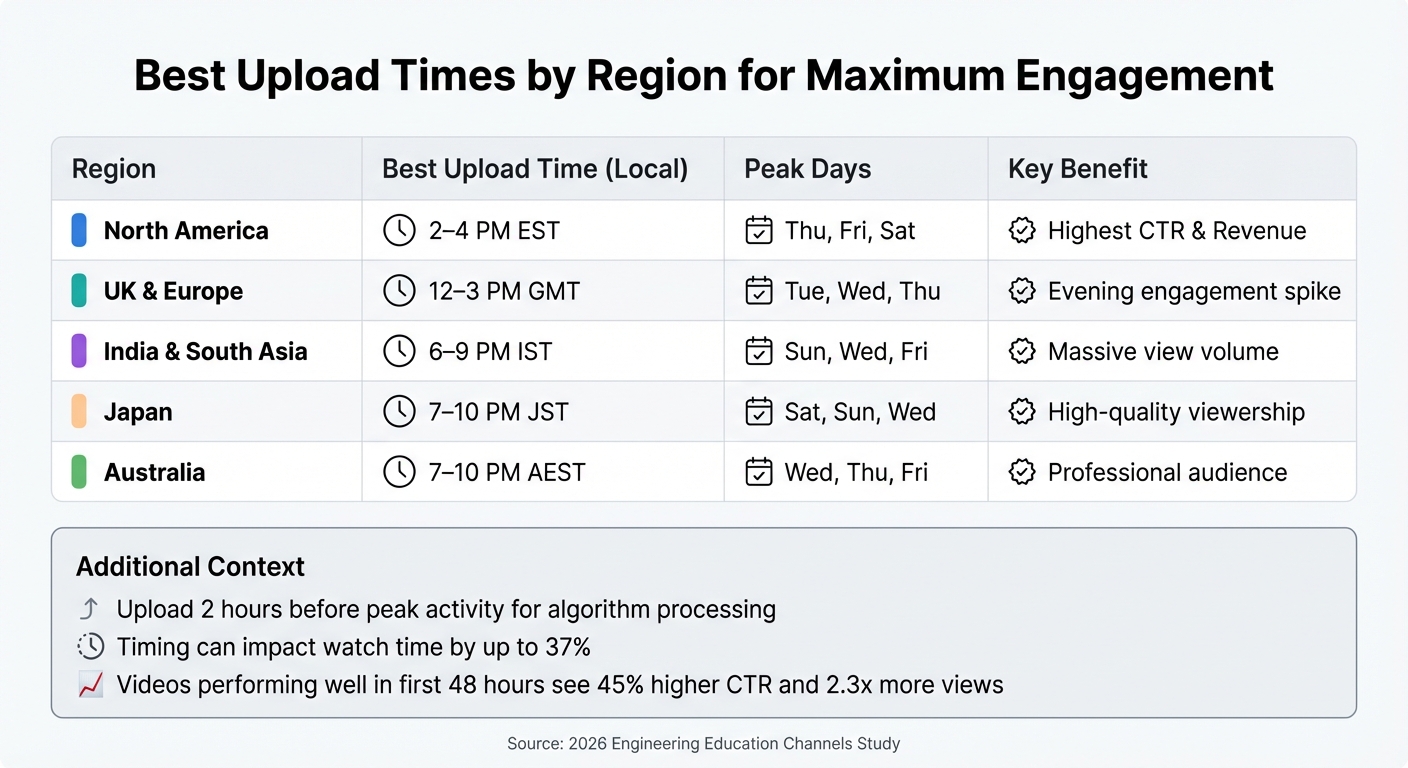
Prioritize high-CPM regions when scheduling uploads. Many creators focus on North American time zones, especially EST, because of the high revenue potential and large audience size. If your audience spans multiple time zones, consider which region offers the best mix of watch time and revenue.
Region
Best Upload Time (Local)
Peak Days
Key Benefit
North America
2–4 PM EST
Thu, Fri, Sat
Highest CTR & Revenue
UK & Europe
12–3 PM GMT
Tue, Wed, Thu
Evening engagement spike
India & South Asia
6–9 PM IST
Sun, Wed, Fri
Massive view volume
Japan
7–10 PM JST
Sat, Sun, Wed
High-quality viewership
Australia
7–10 PM AEST
Wed, Thu, Fri
Professional audience
Before uploading, share teasers about 30 minutes prior and engage with your audience in the first hour. Videos that perform well in the first 48 hours often see a 45% higher click-through rate and 2.3x more views during this critical window.
Using Outlier for Additional Insights
YouTube Analytics is great for showing you where your viewers are located and how long they’re watching. But it doesn’t tell you why certain content performs better in specific regions or what you should focus on creating next. That’s where Outlier steps in - it connects the dots between raw data and actionable strategies. By combining Outlier’s insights with your regional analytics, you can build a more focused and effective content plan.
What Outlier Offers
Outlier takes your regional data a step further by analyzing competitor content and delivering video ideas backed by data. In just two minutes, it can generate suggestions for titles, hooks, and even confidence scores tailored to your channel.
One of its standout features is the ability to identify videos that outperform a channel’s average by 3× to 10×. This helps uncover high-demand topics within specific niches or regions. For example, a video with an outlier score of 2× has double the average views for that channel, while a score of 5× or more hints at potential viral success.
"The outlier ratio is the single most valuable metric. A channel with a high outlier ratio has figured out how to consistently create content that resonates - study those outlier videos closely." - OutlierKit Guide
Beyond demographics, Outlier offers psychographic insights, showing you regional preferences for tone, style, and video length. It might reveal, for instance, that your audience in one region prefers 8–12 minute tutorials, while another prefers 15–25 minute entertainment videos. These insights can help you fine-tune your content and understand how competitors are connecting with similar audiences.
Spotting Trends with Outlier
After identifying your top-performing regions in YouTube Analytics, you can use Outlier to analyze competitors thriving in those same areas. Its Geographic Opportunity Detection tool highlights which topics and formats are resonating regionally. By filtering for outlier scores of 3× or higher, you can zero in on content trends that matter most. For example, if your analytics show strong watch time in Japan, Outlier can help you pinpoint high-demand topics that are currently underrepresented.
When you discover a high-performing outlier in your target region, take a closer look at its title, thumbnail, and topic to understand what’s driving the clicks. You can also review growth trend graphs to see when a competitor experienced a spike in engagement, then analyze the specific content they posted during that time.
Outlier has earned a 4.9/5 rating based on verified reviews, with users highlighting its ability to spot content gaps and underserved audiences. Plus, its affordable pricing starts at just $19/month, making it accessible for creators at all levels.
Conclusion
Understanding your audience through regional analysis goes beyond just knowing where they are - it's about figuring out how to meet their needs effectively. Start by diving into YouTube Studio and exploring the Geography Report. Identify your top 3–10 countries based on watch time, and take a closer look at Average View Duration to uncover potential barriers, such as pacing issues or differences in viewer preferences.
Once you've identified your key regions, put this data to work. For example, if you notice strong watch time from high-CPM countries like the US, UK, or Canada, focus on creating content tailored to these audiences. For regions where English isn't the primary language but engagement is high, adding professional subtitles can make a big difference - boosting watch time by up to 40% in those areas.
Timing matters just as much as content. Use the "When your viewers are on YouTube" report to schedule uploads strategically. Posting 2–3 hours before peak activity times in your top regions ensures your content is ready when your audience is most active. If your largest audience is in a different time zone, adjust your schedule to align with their local hours.
While YouTube Analytics tells you the "what" and "where", tools like Outlier help uncover the "why." Starting at $19/month, Outlier offers insights into competitor performance, content gaps, and audience preferences in specific regions. These insights can guide your strategy, helping you make quicker, data-driven decisions.
The secret to success lies in starting small and testing consistently. Try implementing one specific change based on your regional data - such as tweaking translated titles or adjusting your upload schedule - and track its impact over the next month. Remember, optimizing for regional audiences is an ongoing process.
FAQs
Which regions should I prioritize first?
Dive into your YouTube Analytics and pinpoint the regions where your content gets the most engagement and watch time. The Audience tab in YouTube Studio is your go-to tool for this. It highlights the countries or regions driving the majority of your views and interaction.
Once you know where your core audience is, tailor your content to match their preferences and interests. These regions represent your most loyal viewers, giving you the best chance to grow your channel and keep them coming back for more.
How do I tell if a regional spike is a trend or a one-off?
To figure out whether a regional increase in watch time is part of a larger trend or just a one-time occurrence, dive into your YouTube Analytics over an extended period. Instead of focusing on daily data, review weekly or monthly patterns.
Here's what to look for:
- Recurring patterns: If similar spikes appear across multiple weeks or months, it’s likely a trend worth noting.
- Isolated jumps: If the spike happens only once or for a very short time, it’s probably just a one-off event.
This approach can help you identify long-term viewer behavior instead of being misled by short-term fluctuations.
What’s the fastest way to localize videos for new regions?
To adapt videos for different regions quickly, head to the Audience tab in YouTube Analytics. This section helps pinpoint where your viewers are tuning in from. Use this insight to adjust your content to fit regional tastes, language, and local customs.
Additionally, tools like Outlier can be a game-changer. They provide data-driven, personalized video ideas tailored to specific regions, making it easier to create content that connects with local audiences effectively.


