
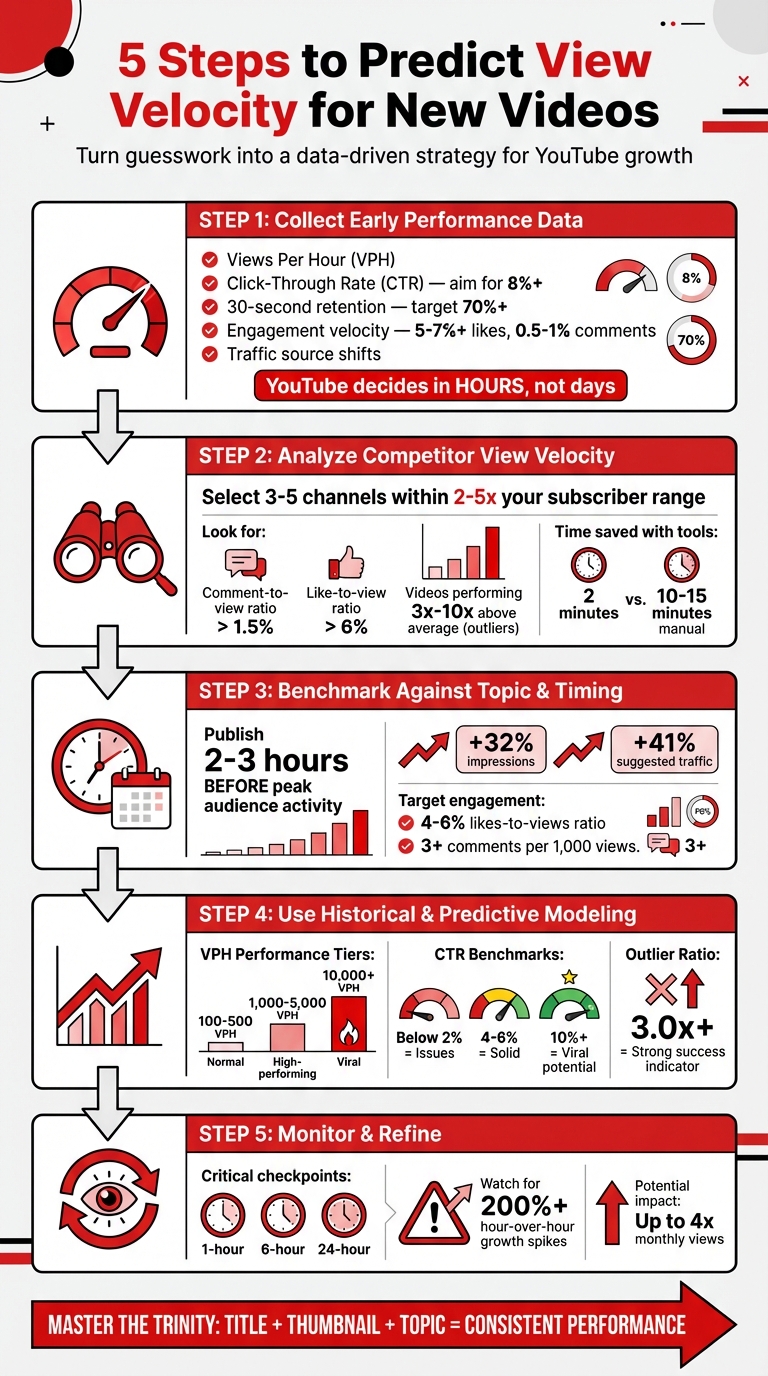
5 Steps to Predict View Velocity for New Videos
Want your videos to gain traction fast? Predicting view velocity - how quickly views accumulate in the first 24–48 hours - can help you optimize content and get noticed by YouTube's algorithm.
Here's how to do it:
- Collect early data: Track key metrics like Views Per Hour (VPH), Click-Through Rate (CTR), and retention within the first 6 hours.
- Analyze competitors: Study 3–5 similar channels to benchmark performance and spot trends.
- Time it right: Publish videos 2–3 hours before your audience's peak activity.
- Use historical data: Compare against your channel's averages to predict performance.
- Monitor and adjust: Track hourly metrics and tweak thumbnails or titles quickly if needed.
Tools like Outlier can simplify competitor analysis and provide actionable insights in minutes. By focusing on early data and trends, you can turn guesswork into a reliable strategy for growing your channel.
5-Step Framework to Predict YouTube Video View Velocity
Video View Velocity Explained
sbb-itb-08cadfc
Step 1: Collect Early Performance Data
The first few hours after publishing your video are like a high-speed test run. YouTube’s algorithm works fast, making promotion decisions within hours rather than days.
Identify Key Metrics
During the crucial first 1–6 hours, there are five metrics you need to monitor: Views Per Hour (VPH), Click-Through Rate (CTR), 30-second retention, engagement velocity (likes and comments per hour), and traffic source shifts. Here's why they matter:
- Views Per Hour (VPH): A rising VPH suggests your video could take off.
- Click-Through Rate (CTR): This reflects how well your thumbnail and title are performing during YouTube’s initial testing phase.
- 30-second retention: Retention above 70% at the 30-second mark signals that your hook is keeping viewers engaged.
- Engagement velocity: High rates of likes and comments per hour (aim for 5–7%+ likes and 0.5–1% comments) indicate that the algorithm is favoring your content.
- Traffic source shifts: If views move from "Subscriber" to "Browse Features" or "Suggested Videos" within the first six hours, it’s a sign that YouTube is testing your video with broader audiences.
Once you’ve gathered this data, compare it to your channel’s usual performance to see how the video stacks up.
Compare Against Topic Averages
Context is everything. A 4% CTR might be great for finance content but underwhelming in entertainment. Use YouTube Studio’s "Real-time" section to check your channel’s typical baseline. The grayed bars will show your average performance - if your video is trending above that line, you’re doing better than usual.
The ContentStats team emphasizes:
"YouTube's algorithm decides in hours, not days. By the time you see daily data, the promotion window may have closed".
If your CTR is below 8% in the first hour, act fast. Testing a new thumbnail immediately can turn things around. This "1-Hour Tweak" strategy can help salvage your video’s launch before YouTube stops testing it. Early performance, especially in the first six hours, plays a huge role in determining whether your video hits its critical 48-hour growth window.
Next up, dive into competitor view velocity to fine-tune these insights.
Step 2: Analyze Competitor View Velocity Patterns
Your video exists in a crowded content space. To stand out, it’s crucial to understand how similar content performs, giving you a realistic benchmark of what success looks like in your niche.
Select Relevant Competitors
Start by identifying 3–5 channels that share your target audience and fall within a 2–5x subscriber range of your own channel. Avoid channels with massive followings - what works for them might not translate to smaller creators.
Use YouTube’s tools to pinpoint these competitors. Search your target keywords and note which channels consistently rank well. Check the "Suggested Videos" on your content, and dive into YouTube Studio’s audience insights to discover what other channels your viewers are watching. Focus on channels with strong engagement metrics: a comment-to-view ratio above 1.5% and a like-to-view ratio over 6% signal a dedicated audience, which often correlates with higher view velocity for their size.
For a faster way to analyze competitors, platforms like Outlier can help. In just two minutes, it can review competitor content from the last 90 days, saving you hours of manual research.
Once you’ve built your competitor list, shift your attention to their performance metrics to uncover actionable insights.
Review Competitor Metrics
Dive into the performance of your competitors’ recent uploads - specifically those from the last 90 days. Instead of focusing on total views, prioritize Views Per Hour (VPH). A video with 50,000 views spread over years doesn’t reflect its current momentum. Typically, a video generating 1,000–5,000 VPH is doing well, while anything above 10,000+ VPH suggests viral potential.
Pay close attention to outliers - videos that perform 3x to 10x better than a channel's average. These outliers often highlight trending topics or successful title-thumbnail combinations. As Aditi, founder of OutlierKit, explains:
"The outlier ratio is the single most valuable metric. A channel with a high outlier ratio has figured out how to consistently create content that resonates".
When you spot an outlier, dig deeper into the "Trinity": the Title, Thumbnail, and Topic that drove its success. These elements often hold the key to its performance spike.
Don’t stop there - explore the comment sections of competitor videos. Look for recurring questions or themes that competitors haven’t addressed. These gaps could be opportunities for your content. Also, watch for changes in their upload schedules or formats that might influence their view velocity.
Keep your competitor list fresh by reviewing it monthly. Remove inactive channels and add up-and-coming creators to ensure your benchmarks remain relevant. This ongoing analysis will keep your strategy sharp and aligned with audience trends.
Step 3: Benchmark Against Topic and Timing Norms
You've collected your early data and taken a close look at your competitors. Now, it's time to put those numbers into perspective by focusing on two key factors: when you publish and what topics are currently resonating in your niche.
Incorporate Publish Timing
Publishing at the right time can significantly boost your video's first-hour performance, which is crucial for gaining momentum. As Iryna Avramenko from ScaleLab puts it:
"Timing matters because of initial velocity... If your core viewers aren't active when the video goes live, the test pool shrinks."
To find the ideal timing, use the "When your viewers are on YouTube" heatmap in the Audience tab of YouTube Studio. The darkest purple blocks show when your audience is most active. Aim to publish your video 2–3 hours before your peak activity window. This gives YouTube enough time to process your video’s metadata, finalize HD quality, and send out notifications. Publishing during peak hours is often too late.
For example, a gaming channel tested this strategy by adjusting their upload time to 2.5 hours before their audience’s peak activity. The result? A 32% boost in impressions and a 41% increase in suggested traffic.
Keep in mind that the best publishing time varies by content type. Long-form videos tend to perform well during "commitment windows", such as weekday afternoons (2 PM–5 PM) or weekend mornings (9 AM–12 PM). Meanwhile, Shorts thrive during "scroll windows", like morning commutes (7 AM–9 AM) or evening relaxation hours (7 PM–10 PM).
Apply Data-Backed Insights
Timing is only part of the equation - your content needs to be relevant and engaging to succeed. Even if you nail the timing, a weak topic won’t perform. Building on the competitor analysis from Step 2, focus on topic-specific performance trends rather than relying on generic averages. For example, a video on productivity hacks will likely follow a different engagement pattern than a gaming or cooking video.
When evaluating competitors, prioritize views-to-subscribers ratios over total view counts. For instance, a channel with 10,000 subscribers and 15,000 views (a 1.5x ratio) is performing better than one with 100,000 subscribers and 80,000 views (a 0.8x ratio). Engagement metrics also matter: aim for a 4–6% likes-to-views ratio and at least 3 comments per 1,000 views to gauge strong audience interaction.
Tools like Outlier can simplify this process by analyzing 90 days of competitor content in just a couple of minutes. It highlights which topics and formats are driving the most view velocity in your niche, providing confidence scores and actionable data. This way, you can set realistic benchmarks based on what’s actually working, rather than relying on guesswork.
Step 4: Use Historical and Predictive Modeling
Now that your benchmarking is done, it’s time to turn past performance into accurate predictions. By combining your channel’s historical data with proven ratios, you can forecast how your next video might perform during that crucial first 24 hours.
Use Historical Baselines
Start by figuring out the average views per video from your last 50 uploads. This gives you a baseline for what’s "normal" on your channel. If you don’t have 50 videos yet, look at similar-sized competitors (2–5x your current size) instead of massive channels - they provide a more realistic comparison.
YouTube Studio’s "gray band" in the retention report can help you spot when a video performs outside your usual range. Pay extra attention to videos that get 3x to 10x your average views - these "outliers" highlight topics and formats that resonate with your audience. These patterns are worth replicating.
Use Ratios to Forecast Performance
With your baseline in place, focus on metrics like Views Per Hour (VPH) to predict how quickly your video will gain traction. Here’s a quick breakdown:
- Normal videos: 100–500 VPH
- High-performing videos: 1,000–5,000 VPH
- Viral videos: 10,000+ VPH
Keep an eye on VPH during the first 2 hours to determine if your video is on track for strong performance.
Click-Through Rate (CTR) and retention are also key. A CTR below 2% suggests issues, 4–6% is solid, and 10%+ hints at viral potential. But CTR isn’t the whole story - if your Average View Duration (AVD) is low, YouTube may limit your video’s reach despite high early clicks. For educational videos, aim for 50–60% retention. For Shorts, retention needs to hit 80–90% to sustain momentum.
You can also calculate an Outlier Ratio by dividing your video’s views by your 50-video average. A ratio of 3.0x or higher is a strong indicator of success. These metrics turn raw numbers into actionable insights.
Use Outlier for Personalized Ideas
Once you’ve gathered your data, tools like Outlier can transform it into creative, tailored video concepts. Outlier analyzes 90 days of competitor content to identify trends in your niche, focusing on videos that perform 3x–10x above average. It breaks down the winning combination of Title, Thumbnail, and Topic that drives results.
For example, a cooking creator used Outlier to spot a competitor’s 7x outlier for "5-ingredient dinners." They adapted the format into a new series that tripled their typical view velocity. Outlier even provides suggested titles, hooks, and confidence scores in just 2 minutes, giving you predictions based on proven trends instead of guesswork.
Step 5: Monitor and Refine Predictions
Keep a close eye on view velocity to capture those crucial early moments. With YouTube making promotion decisions within hours, missing key performance windows - like the 1-hour, 6-hour, and 24-hour marks - can cost you valuable momentum. By combining early data collection with competitor analysis, you can continuously refine your forecasts as your video gains traction. Regular monitoring at these specific intervals ensures you're ready to make real-time adjustments that keep your predictions on track.
Track Early Performance Signals
Instead of focusing solely on total view counts, pay attention to Views Per Hour (VPH). This metric gives you a better sense of whether your video is gaining steam, leveling off, or losing momentum. Viral opportunities can disappear fast - sometimes within 12 hours - if retention drops after the 6-hour mark. Use the 1-hour VPH to confirm if your video's performance aligns with your benchmarks. If your Click-Through Rate (CTR) is underperforming in the first 1–3 hours, consider making quick tweaks to keep the momentum alive. Hourly tracking and rapid optimizations can significantly boost your monthly views - potentially by up to 4x. Set alerts for instances where view growth surges by more than 200% hour-over-hour, signaling the need to adjust your predictions.
Leverage Insights from Competitors
Competitor trends can have a direct impact on your video's performance. If several creators in your niche experience a spike at the same time, it could point to a broader trend rather than an isolated issue with your content. Tools like Outlier provide quick, 2-minute reports that highlight videos performing 3x to 10x above a channel's average. These insights help you validate whether your forecasts align with current audience demand.
Take this example: A finance creator tracking 10 competitors noticed that three of them started posting YouTube Shorts in the same month. By identifying this trend early, the creator pivoted to a Shorts strategy before the rest of the niche caught on, gaining an edge. Keep tabs on 5–10 channels that are 2x–5x larger than yours to identify realistic growth opportunities and emerging strategies. If a competitor suddenly experiences a growth spike, dive into their content or strategy changes to fine-tune your own predictions.
Conclusion
Using the five-step framework outlined earlier, predicting view velocity becomes less about guesswork and more about actionable insights. By gathering early performance data, studying competitor trends, benchmarking results, leveraging historical patterns, and tracking ongoing performance, you can shift from relying on hope to employing a data-driven approach. Top creators consistently use competitor data to shape their strategies.
Pay close attention to outlier videos - those performing 3× to 10× better than average - to uncover trends that resonate with audiences. Mastering the "trinity" of Title, Thumbnail, and Topic is key to producing content that consistently connects with viewers.
While manually analyzing competitors might take 10–15 minutes per video, tools like Outlier can cut this time down to just 2 minutes. Outlier offers personalized video suggestions, complete with titles, hooks, confidence scores, and view velocity data, all based on competitor analysis from the past 90 days. This automation allows you to spend less time on analysis and more time crafting content that engages your audience.
To refine your strategy, analyze 5–10 channels (ideally 2–5× your size), identify videos that perform 3× or better, and apply these insights to your uploads. By consistently tracking and adjusting your methods, you'll create a dependable system for predicting view velocity and unlocking your content's full potential.
FAQs
What’s the fastest way to estimate my 24-hour view velocity?
To get a quick estimate of your video's 24-hour view velocity, take a close look at its performance data during the first day after publishing. Real-time or hourly analytics can reveal view trends, like sudden spikes or noticeable increases compared to your channel's usual performance. These insights can help you gauge whether your video is exceeding expectations or falling short, giving you an early idea of its overall trajectory.
Which early metrics matter most if I can only track a few?
When you're analyzing your video performance, three metrics stand out as crucial during the early stages: Outlier Scores, Click-Through Rate (CTR), and Audience Retention.
- Outlier Scores: These scores measure how a video stacks up against your usual content. A higher score, like 3x, is a clear sign that the video is resonating well with your audience.
- Click-Through Rate (CTR): This metric tells you how compelling your thumbnail and title are. A strong CTR means viewers are intrigued enough to click and watch.
- Audience Retention: This shows how well your video holds the audience's attention, particularly during those critical first 30 seconds. If viewers stick around, it's a good indicator your content is connecting.
By keeping an eye on these metrics, you can quickly gauge how your video is performing and make adjustments if needed.
When should I change my title or thumbnail after publishing?
If your video isn’t performing well within the first 24–72 hours, it might be time to rethink your title or thumbnail. Why? Early view velocity plays a huge role in how YouTube decides to promote your content.
Keep an eye on key analytics like click-through rates (CTR) and engagement during this period. If these numbers are underwhelming, switching up your title or thumbnail could make a big difference. A fresh, more eye-catching title or thumbnail might grab the attention your video needs to gain momentum during this crucial window.


