
How Trend Data Drives Viral Video Success
Ever wonder why some videos go viral while others fail to gain traction? The secret lies in trend data - analyzing emerging topics and audience behaviors to act early. By 2026, creators are leveraging tools like Real-Time Intent Mapping and metrics such as Node Velocity to predict trends before they peak. Here’s what you need to know:
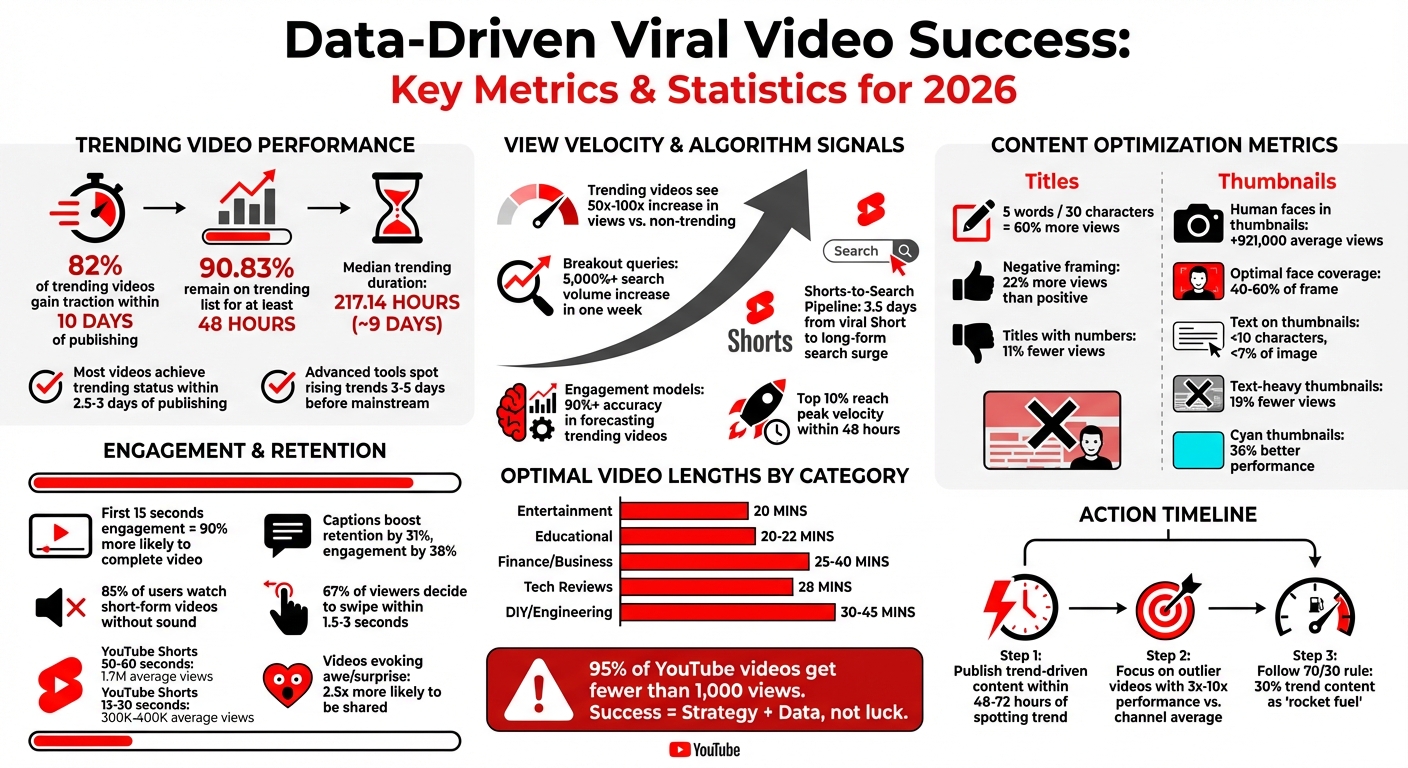
- 82% of trending videos gain traction within 10 days of publishing.
- Advanced tools can spot rising trends 3–5 days before they hit mainstream.
- YouTube's 2026 algorithm prioritizes viewer satisfaction over clicks, focusing on rewatch rates and video completion.
Key strategies for viral success include:
- Using Shorts-to-Search patterns to predict long-form content demand.
- Crafting engaging hooks and titles under 30 characters.
- Optimizing thumbnails with human faces and minimal text.
Acting fast is critical - publish trend-driven content within 48–72 hours of spotting a trend. Tools like Outlier help creators analyze competitors, identify outlier videos, and refine scripts for maximum engagement. Viral success isn’t luck - it’s about using data to create content your audience wants.
YouTube Viral Video Success: Key Statistics and Metrics for 2026
Research Findings on YouTube Trends
Key Signals of Trending Content
Content creators rely on specific indicators to spot trends before they peak. One of the strongest signals is view velocity - the speed and acceleration at which a video accumulates views, rather than just the total number of views. Trending videos often experience a 50x–100x increase in views compared to non-trending ones.
By 2026, YouTube's algorithm has shifted its focus to "Satisfaction Signals." These include metrics like rewatch rates and "pause-and-reverse" actions, which suggest that viewers find the content genuinely engaging. Another key metric is the view-to-subscriber ratio. For instance, if a channel with 10,000 subscribers suddenly garners 500,000 views on a video, it signals a high-velocity trend, prompting the algorithm to amplify its reach.
The Shorts-to-Search Pipeline has also emerged as a valuable trend predictor. Viral formats or audio clips on Shorts often lead to a surge in long-form search interest within about 3.5 days. Creators who track this pattern can time their long-form content to capture the wave of traffic. Additionally, "Breakout" queries identified through Google Trends - marked by search volume increases of over 5,000% in a single week - act as early indicators of explosive trends.
These signals not only help identify trends but also influence a video's overall performance, as detailed below.
How Trends Impact Video Performance
Research highlights how these trending signals translate into measurable success. Once a video starts trending, it often enjoys sustained visibility. Data shows that 90.83% of trending videos remain on the trending list for at least 48 hours, with a median duration of about 217.14 hours (roughly nine days). Most videos achieve trending status within 2.5 to 3 days of being published.
The algorithm also considers "Semantic Pair Success", which measures how well a trending topic aligns with a channel's usual content. Sticking to trends within your niche can provide an authority boost, increasing visibility and improving the algorithm's predictive accuracy. In fact, engagement-based models are now over 90% accurate in forecasting whether a video will trend. For creators who understand these metrics, this data provides a clear strategy to optimize their content for success.
sbb-itb-08cadfc
How To Find Trending Topics On YouTube Before Everyone Else
Common Characteristics of Viral Videos
Understanding what drives a video to go viral involves recognizing the specific elements that boost viewer engagement and encourage sharing.
Content Types That Perform Best
Different types of content thrive at varying lengths, depending on the audience's needs:
- Entertainment videos perform best at around 20 minutes.
- Educational content hits its stride between 20–22 minutes.
- Finance and business topics do well at 25–40 minutes.
- Tech reviews peak at 28 minutes.
- DIY and engineering videos excel with lengths of 30–45 minutes, as viewers often expect detailed, comprehensive information.
Videos that trigger strong emotions - such as joy, anger, or controversy - tend to outperform neutral or purely informational content. In fact, videos that evoke awe or surprise are 2.5 times more likely to be shared compared to those that stir low-energy emotions like contentment. While sadness is rare in viral thumbnails (appearing in just 1.8%), it surprisingly garners the highest average view count at 2.3 million views.
The Role of Hooks and SEO
The first few seconds of a video are absolutely crucial. If viewers stay engaged for the first 15 seconds, they’re up to 90% more likely to watch the entire video. Adam Mosseri, Head of Instagram, emphasizes this point:
"The first 3 seconds of your video is important. The top three signals that matter most for ranking are watch time, likes and sends".
Brendan Kane, Founder of Hook Point, adds:
"Going viral isn't luck; it's a science. Most people have great content and it's not the content, it's the context of how you're representing that content".
Titles play a bigger role than many realize. Short titles - around 5 words or 30 characters or fewer - attract 60% more views than longer ones. Negative framing, such as highlighting mistakes or dangers, draws 22% more views than positive framing. Interestingly, titles with numbers (e.g., "5 Tips") tend to underperform, receiving 11% fewer views on average.
Thumbnails also follow clear patterns. Including a human face can add an average of 921,000 more views compared to videos without one. For the best results, faces should occupy 40–60% of the frame and display high-contrast visuals with exaggerated emotions. Text on thumbnails should be minimal - under 10 characters and covering less than 7% of the image - as text-heavy thumbnails see 19% fewer views. Surprisingly, cyan-colored thumbnails perform about 36% better than the platform average.
These strategies not only improve initial engagement but also increase the likelihood of viewers sharing the content.
Shareability and Social Proof
The shareability of a video isn’t left to chance; it’s carefully crafted using specific techniques. Since 85% of users watch short-form videos without sound, bold text overlays and captions are essential for maintaining attention. Captions alone can boost retention by 31% and engagement by 38%.
Brands like Sephora and Nike have mastered these techniques. Sephora’s Reels campaign used "blurred focus to clear reveal" hooks, increasing watch time by 41% and engagement by 27%. Nike’s TikTok campaign, which began with "pattern interrupt" visuals - jarring footage of common running mistakes - achieved a 48% higher retention rate and a 32% increase in product page visits.
For YouTube Shorts, videos lasting 50–60 seconds perform best, averaging over 1.7 million views, compared to shorter videos of 15–30 seconds, which average between 300,000–400,000 views. With 67% of viewers deciding whether to swipe away within the first 1.5 to 3 seconds, seamless loops that naturally replay are increasingly popular, as they encourage replays that algorithms favor.
Engagement metrics like likes and comments are stronger indicators of a video’s algorithmic success than raw view counts. Social proof - through community reactions, testimonials, or thumbnails featuring multiple faces - signals quality and encourages clicks. Recently, the trend has shifted from single exaggerated faces to thumbnails with multiple faces, which suggest collaboration, conflict, or shared experiences, often hinting at higher production value.
Using AI and Big Data for Trend Analysis
With more than 500 hours of video uploaded every minute, keeping up with trends manually is out of the question. That’s where AI and big data come in. These tools sift through immense volumes of search queries, engagement spikes, and social media activity to spot trends 3 to 5 days before they hit mainstream trending feeds. This flood of data requires leveraging YouTube's native analytics to better understand viewer behavior.
YouTube's Analytics and Personalization Tools
YouTube’s analytics are at the heart of data-driven trend spotting. The platform tracks key metrics such as view velocity (how quickly views accumulate in the first 48 hours), audience demographics, and viewer retention patterns. Importantly, YouTube’s algorithm now prioritizes Satisfaction Signals over simple click counts. These include metrics like rewatch rates, pause-and-reverse behavior, and video completion rates.
Another shift is YouTube’s focus on "Watch Time Quality" rather than just total watch time. For instance, a 5-minute video that viewers rewatch key moments of can rank higher than a longer video with passive viewing. Post-video surveys and return viewer rates also contribute to gauging audience satisfaction. Creators rely on metrics like impression click-through rates (iCTR), average view duration (AVD), and audience watch rate (AWR) to fine-tune their content. For trending videos, successful iCTR values usually fall between 5% and 10%.
AI Tools for Competitor Analysis
AI tools go beyond YouTube’s built-in analytics by offering deeper insights into competitor performance and emerging trends. These systems use statistical outlier detection to flag videos that outperform expectations - those receiving 3x to 10x more engagement than a channel’s average. For example, if a channel with 10,000 subscribers suddenly has a video hit 500,000 views, AI tools highlight this as a potential trend.
Advanced platforms also track "Node Velocity", which measures the rapid growth of interest clusters, such as "Sustainable Tech" or "AI Productivity Tools". Lamrin, Lead Engineer at ContHunt, explains:
"Data is the new oil, but trending data is the refined fuel. If you're not tracking the velocity of search intent, you're driving a creator vehicle with no engine".
These tools also perform multimodal content analysis, breaking down visual elements (like colors and pacing), audio patterns (such as music and speech), and metadata (tags and descriptions) to uncover what makes content go viral. Predictive models powered by time-series analysis and neural networks can estimate a trend’s lifecycle, peak, and decline. Interestingly, the top 10% of trending videos reach peak velocity within 48 hours, emphasizing the need to act quickly when spotting new opportunities.
How to Use Outlier for Trend-Driven Content
Outlier makes analyzing trends a breeze. Instead of spending hours tracking competitors and guessing which topics might resonate, this platform delivers customized video ideas in just 2 minutes by analyzing recent competitor and trend data. Its Score Algorithm evaluates how a video performs compared to its channel average. For instance, a 10x score means the video received ten times the views of the channel's usual average.
Get Personalized Video Ideas in 2 Minutes
Outlier tailors video concepts to your niche by scanning categories like tech, cooking, or gaming. It provides suggested titles, hooks, and confidence scores based on metrics like view velocity and past performance patterns. This approach is especially useful for spotting small channel outliers - videos from channels with fewer than 100,000 subscribers that achieve breakout success. These examples show viral potential isn't limited to large audiences. Ryan Park, a tech educator with 380,000 subscribers, shares:
"The outlier finder is like having a crystal ball for YouTube. I found a small channel in my niche that had one video with 2 million views while their average was 20K. That 100x outlier told me the topic was gold".
These insights streamline competitor analysis and help you identify trends faster.
Analyze Competitor Trends Quickly
Once you have personalized insights, Outlier's Deep Research Tool uses AI to study audience behavior and trending themes in competitor content. It highlights the top 3–5 topics driving most of their growth and uses the Content Matrix to map topics against video formats. This reveals opportunities where demand is high but competition is limited. For the best results, focus on videos with at least a 3x outlier score, as lower scores often reflect typical performance variations. After identifying a strong outlier, analyzing the "Trinity" - the title, thumbnail, and topic combination - can reveal the elements driving its success.
These tools provide a foundation for crafting strategies to boost engagement.
Improve Engagement with Data-Backed Strategies
Outlier equips creators with actionable insights to enhance engagement. The AI Script Analyzer evaluates elements like hook strength, curiosity loops, and pacing to help improve viewer retention. Swapnil, founder at Cactro, highlights its impact:
"The script analysis feature is incredible. It showed me exactly why my hooks weren't working. Fixed it, and my numbers improved dramatically".
The platform also offers Trend Timing Analysis, which helps distinguish between evergreen topics and fleeting trends. This ensures creators know whether it's still worth pursuing a topic. For trends, publishing content within 48–72 hours of spotting them is key to capturing peak interest. Lisa Thompson, a DIY creator with 290,000 subscribers, explains:
"OutlierKit's outlier finder showed me formats and topics I never would have considered... I pivoted my content strategy and tripled my average views".
Conclusion
Trend data turns YouTube success into a process you can replicate. Spotting emerging topics early allows creators to rack up views before the market becomes overcrowded. At the same time, studying outlier videos - those performing 3× to 20× better than a channel’s average - reveals what truly connects with audiences. The key is to strike a balance between timeless, evergreen content and trend-focused videos. Many creators follow the 70/30 rule, where 30% of content serves as "rocket fuel" to drive viral growth. But success here requires quick action.
Timing matters. Publishing trend-driven content within 48–72 hours ensures creators hit the peak of audience interest. Those who combine this speed with a data-backed approach - analyzing titles, thumbnails, and topics from their top-performing videos - consistently outperform creators relying purely on guesswork. The formula is simple: fast execution combined with smart analysis.
Using real-time trend insights alongside content optimization is a proven way to succeed. Tools like Outlier make this easier by providing personalized insights, such as confidence scores, suggested hooks, and competitor analysis tailored to your niche. Its AI-powered features evaluate everything from script ideas to content gaps, helping creators find high-demand, low-competition opportunities before the market becomes oversaturated. As Aditi, the Founder of OutlierKit, explains:
"95% of YouTube videos get fewer than 1,000 views. The difference between those videos and the ones that succeed? Strategy backed by data, not luck".
In a world where over 800 hours of video are uploaded every minute, data-driven decisions - not just talent - are what set successful creators apart. Strategic trend analysis is the edge that turns stagnation into growth.
FAQs
What trend signals should I watch first?
To stay ahead in content creation, begin by keeping an eye on emerging topics using real-time data and predictive analytics. These tools can help you identify trends before they hit their peak, giving you the edge to act early. Platforms that track trends can uncover valuable insights, like trending themes or shifts in audience preferences, ensuring your content strategy aligns with what people are looking for.
How fast do I need to publish after spotting a trend?
Publishing your content promptly after spotting a trend is key. Aim to release it during the trend's rising phase. Why? Because acting fast allows you to capture attention while the topic is still gaining traction. The earlier you jump in, the better your chances of maximizing views and engagement. Timing is everything.
Which YouTube metrics matter most for “viewer satisfaction”?
YouTube's algorithm has shifted its focus to prioritize viewer fulfillment rather than just watch time. This means it’s not about how long someone watches your video but how much value they get from it.
The key metrics YouTube uses to measure viewer satisfaction include:
- Return Rate: How often viewers come back to your channel for more content.
- Active Sharing: When viewers share your videos with others, showing they found the content worthwhile.
- Engagement Signals: This includes meaningful interactions like comments, likes, and responses to satisfaction surveys.
In short, YouTube now emphasizes creating content that truly resonates with and benefits your audience.


